
Create Reports and View Data
1. Create Custom Report
- Navigate to the" Custom Reports" page from the left hand menu.
- Click the blue "+" button in the top right corner to open the Report Creation page
- Add a Report Title to the corresponding field.
2. Choose Columns:
- Under the 'Set Columns' section, check the box beside a column header to add it to your report. Customize your report by selecting columns based on exhibitor information. This can include a range of data, including company details, stand information, custom fields, and user information.
3. Choose Parameters:
- Utilise the Tasks section at the bottom of your options to select the parameters for your report. Users can choose from various options such as task status, task responses, and submission dates.
4. Preview Report:
- To the right of the screen, you can preview which columns you have selected to add to your report. You can remove any column by clicking the 'X' beside the column header or reorder by dragging by the grip icons.
- You can add as many sheets as required to the same report by clicking the "Add+" button (Add sheet 1. add sheet 2 etc)
- After adding a report title, configuring the parameters and choosing columns, proceed to generate the report by clicking the "Create Report" button. The platform will compile the requested data into a comprehensive report format.
6. Review and Analyze Data:
- Once the report is generated, it will now appear on the Customer Reports tab. Subsequently created Reports will appear as tabs on this screen also.
- Use the on-screen report review and analyze the data to gain insights into exhibitor activities and engagement on the platform.
Use the 'Search' function to search for specific data on your report.
Click the arrow beside any column header to sort the data.
Click the "Filter" button to filter the data on your report.
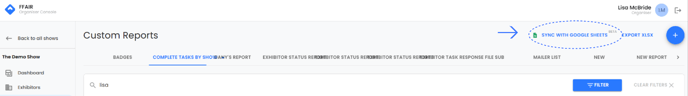
7. Export Report:
- Use the "Export XLSX" button to export the report data in your preferred format for further analysis or sharing purposes.
8. Sync with Google Sheets
To use the Sync with Google Sheets feature, you need to first contact us so that we can set this up for you. You will not be able to use this feature otherwise. You can contact us @ support@ffair.io.
- We will confirm via email that we have set up your email address for syncing.
- Navigate to the "Custom Reports" page.
- Click "Sync with Google Sheets"

- Choose the google account you wish to sync with.
- Click 'OK' to sync.
- Navigate back to the "Customer Reports" page.
- If syncing is switched on you will see a
 icon beside the "Sync with Google Sheets button.
 - Click the "Sync with Google Sheets" button at any time to switch syncing off.
9. How/when to use syncing?
When you switch the syncing on, your synced Google sheet will be a live report and it will automatically update with any new data. For example, if you create a report to show you exhibitor's task status, every time an exhibitor task status updates in the FFAIR platform, your google sheet will update automatically.
Similar to exporting (yet more efficient), this feature offers you the flexibility to analyze and work with your data outside the platform. Additionally, you only need to share your Google Sheet once with other team members or relevant individuals to provide them with access to a live, up-to-date report.